
Clarity > Clutter: Mastering Journey Efficiency with Knotch Data
At Knotch Labs, we set out to answer a simple but critical question: Do fewer, more streamlined journeys lead to more efficient conversions?
Our hypothesis: When journeys are shorter, clearer, and require fewer steps, audiences convert faster and at higher rates.
The data confirmed our thinking, but the real breakthrough came when we stopped looking at sitewide averages and broke performance down by mobile vs. desktop. That’s where the story of pathway efficiency emerged.
Key Takeaways:
- Mobile as a model: Fewer steps and sessions result in faster conversions.
- Desktop complexity costs: More exploration leads to diluted conversion efficiency.
- Sitewide metrics can mislead: Aggregated data can mask critical device-specific differences, hiding optimization opportunities.
Defining a Pathway
A pathway is the unique sequence of steps a user takes to reach conversion, spanning pages and sessions, not just clicks.
A higher number of pathways means there are more diverse routes leading to conversion, but it doesn’t necessarily mean longer or more complex journeys for individual users.
Pathway efficiency measures how well a journey converts relative to the effort required. Effort includes steps, sessions, and time to convert. Outcomes include conversion rate, total conversions, and the number of conversion pathways. Efficient pathways require less effort and deliver stronger conversion outcomes, while inefficient ones demand more exploration, take longer, and convert at lower rates.
- Fewer steps, sessions, and time = higher efficiency.
- More exploration and complexity = diluted performance.
(Note: We looked at medians, not averages, to avoid outliers that can skew results.)
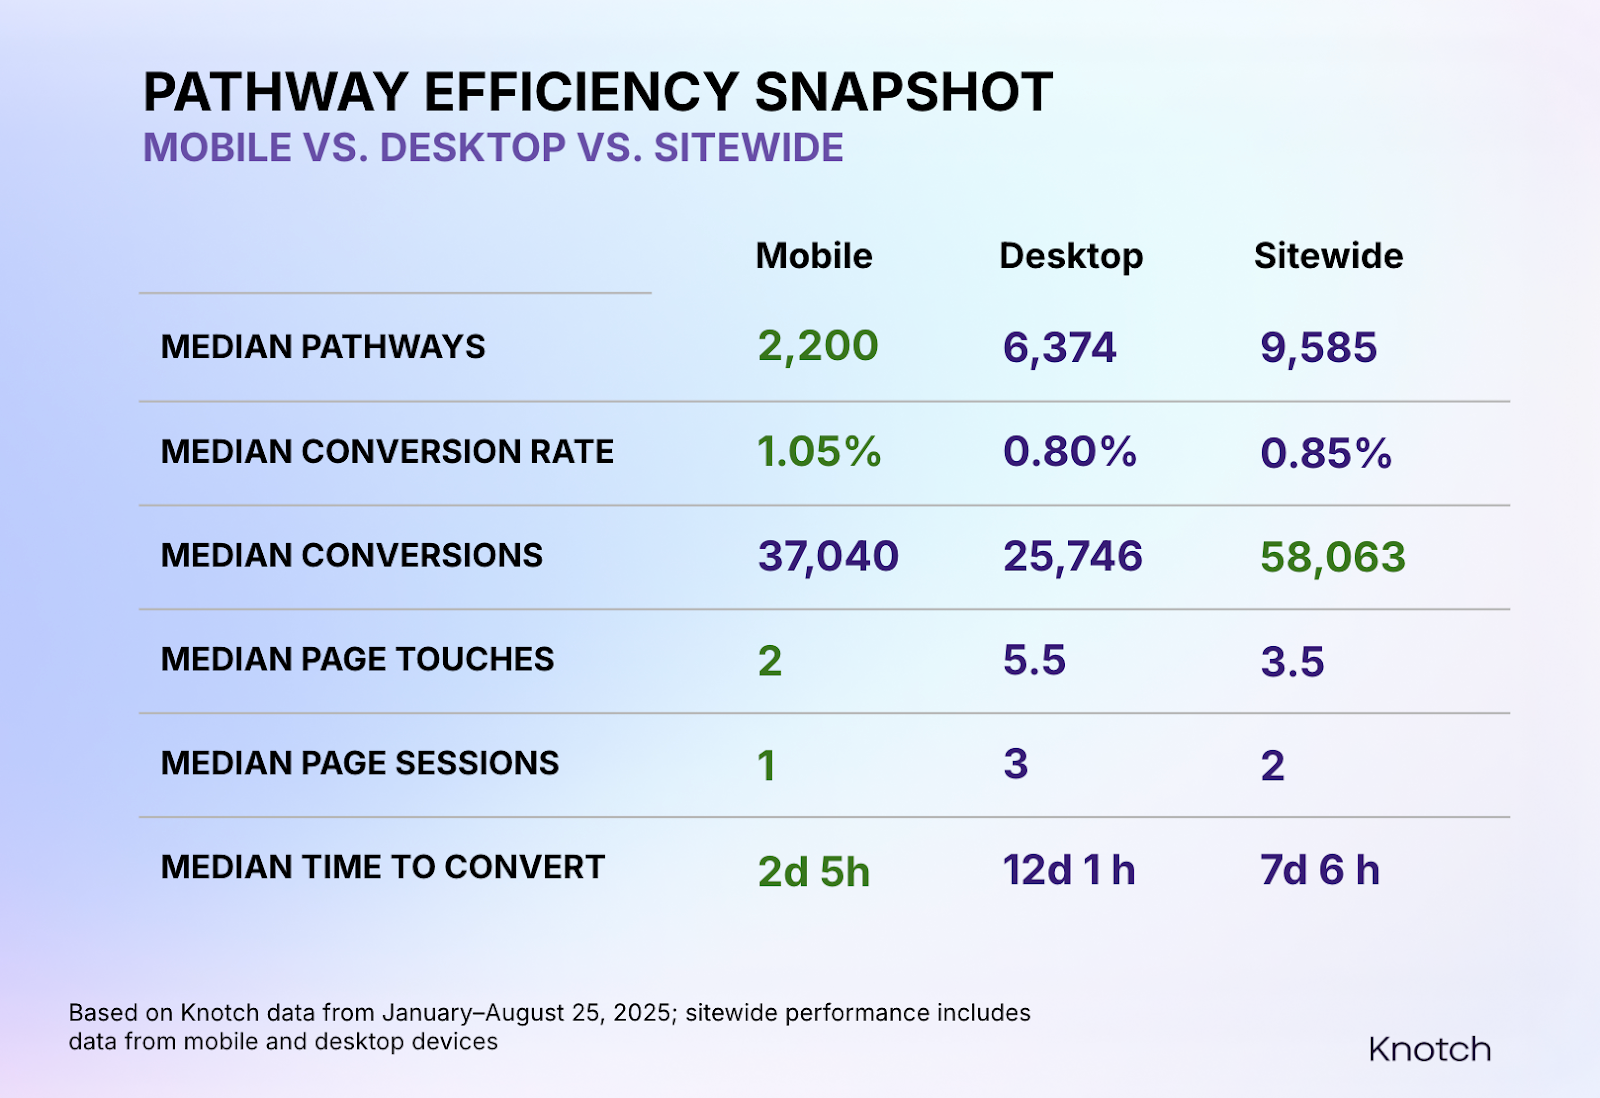
Mobile Journeys: The Efficiency Benchmark
Mobile pathways excel with fewer steps, fewer sessions, and less time to convert compared to desktop or sitewide averages.
Desktop Journeys: Complexity Dilutes Efficiency
Desktop experiences introduce more exploration, resulting in longer conversion journeys and lower conversion rates. The added complexity of more steps across sessions dilutes efficiency.
Sitewide Averages: Concealing Contrasts
Aggregated sitewide metrics blend desktop and mobile together, often masking key behavioral differences. What looks like “middle of the pack” performance is actually the sum of two very different stories: the efficiency of mobile and the complexity of desktop.
The same principle applies to content engagement metrics. Low scroll depth or short time on page can look like failure when viewed in isolation, but these pages often recirculate users into higher-value steps that boost overall pathway efficiency. Explore how “underperforming” pages fuel conversion.
A Real-World Example: Apple.com
Apple’s website highlights how pathway design varies between desktop and mobile.
- Desktop: The Store landing page features multiple navigation bars, product categories, shopping guides, accessories, and promotional banners, offering over 30 clickable actions on page load. This variety supports browsing but can complicate the path to purchase.
- Mobile: Navigation is streamlined into a single menu, content stacks vertically, and CTAs are prioritized. Pathways are fewer, clearer, and more direct.
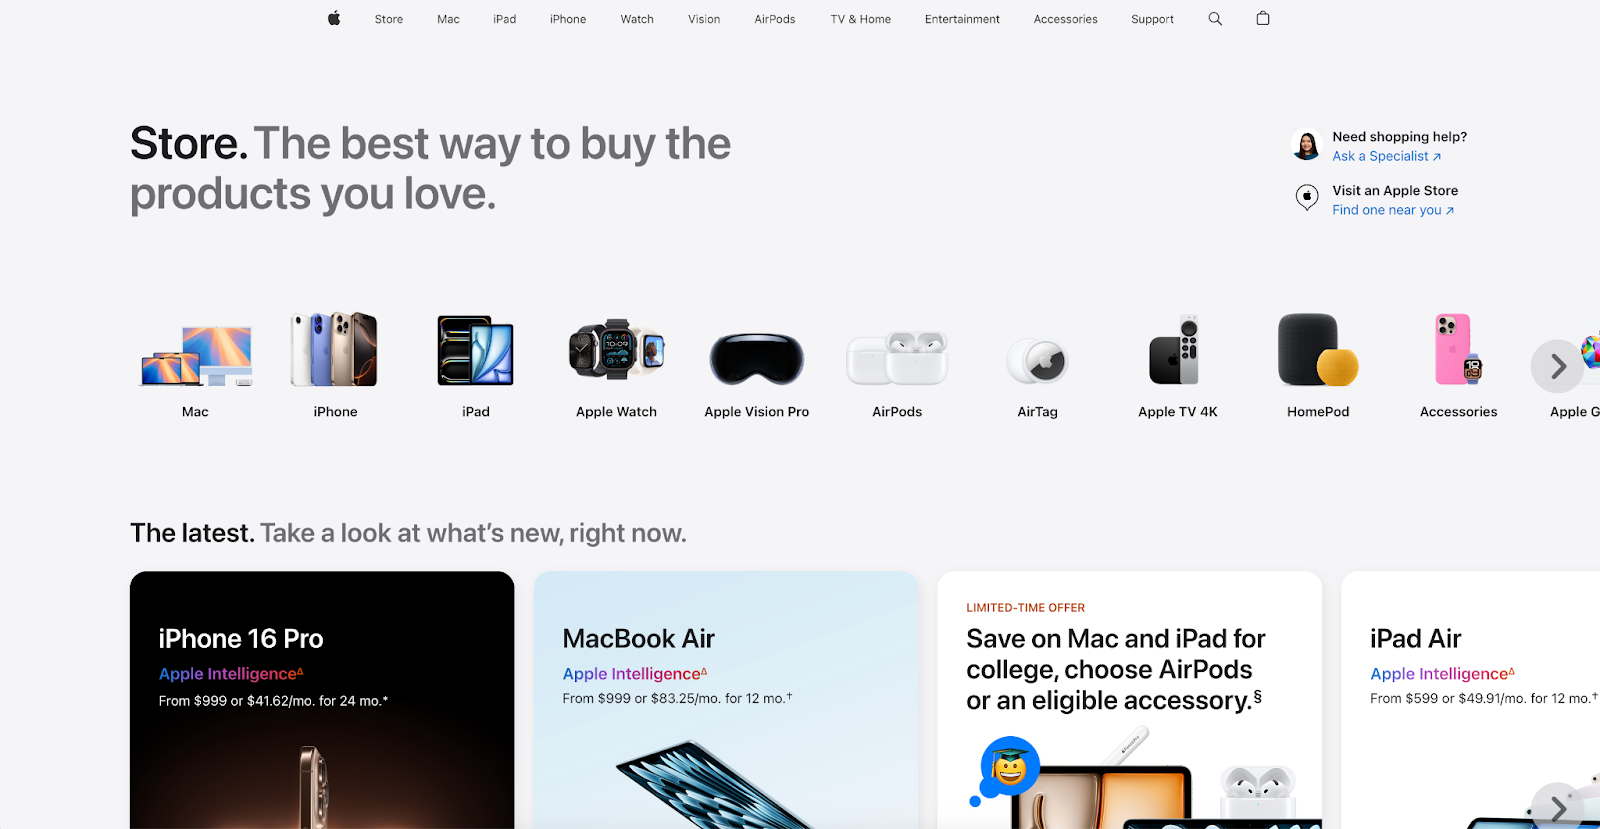

This example mirrors Knotch Labs data: Mobile pathways are more efficient because they limit distractions and guide audiences toward the intended action. Desktop offers choice but risks diffusion.
What Marketers Should Do
- Establish KPI around pathway efficiency: Track pathway efficiency benchmarks (such as conversions per pathway) alongside conversion volume to give visibility into the quality of journeys—helping spot when efficiency is improving or complexity is increasing.
- Audit desktop journeys: Identify and streamline long or underperforming pathways. Focus on pathways with high page touches or multiple sessions, as these often signal inefficiency.
- Embrace mobile-first design: Use mobile as the efficiency model and apply its principles across desktop experiences. Create a test plan to identify which elements of mobile-first design improve efficiency most.
Example: Test whether having one clear CTA above the fold drives faster conversions compared to multiple CTAs spread throughout the page. This ensures simplification efforts are backed by evidence and tailored to deliver measurable outcomes.
- Measure efficiency, not just totals: Don’t stop at conversion volume. Track pathways, sessions, and time to convert to identify which journeys deliver efficient results and which create wasted effort.
The Bottom Line
Efficiency isn’t about offering more pathways; it’s about crafting the right ones. Mobile shows the blueprint: fewer steps and clearer flows lead to faster outcomes. By simplifying journeys and drawing inspiration from mobile, marketers can boost conversion rates, reduce wasted effort, and maximize ROI.
Published on September 8, 2025
Become a thought leader
Become a thought leader


Trusted by the largest (and now smartest) brands in the world.
“Before Knotch we did not understand what content was driving business results. Now we understand which content moves the needle. Knotch’s cohesive reporting and insights paint a real picture of what’s happening on our website instead of the patchwork quilt that comes from a Google Analytics approach. With Knotch we have been able to re-prioritize ad spend, route better leads to our SDR team, and inform our content development initiatives.”

"The Knotch platform ensures that we deliver high-performing content tailored to young home shoppers, enhancing their experience and driving better business outcomes.”

"Our partnership with Knotch has been highly successful, empowering us to leverage data-driven insights and refine our content strategy.”